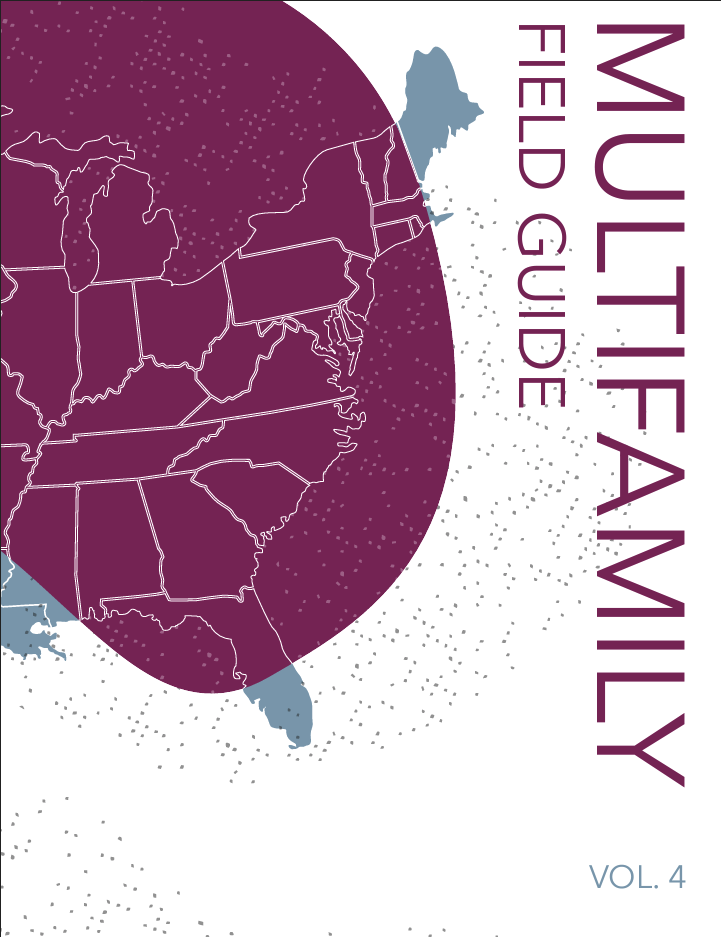
As you make decisions about your multifamily strategy, tactics and investments for the year ahead, there’s a lot riding on what you, as multifamily marketers, choose to place your attention, dollars, and even reputation on.
Though hunches and past successes can make good discussion points, nothing beats data when it comes to protecting your investments against an expensive (and perhaps embarrassing) flop.
Wouldn’t it be nice if you could defend those decisions with mathematical precision? Allow us to help with that.
As marketers, we know the value of reliable data — and how hard it is to come by, especially when it comes to actionable, trending renter behaviors.
- What rental unit features get renters to swoon?
- What’s top of mind when they consider their dream apartment?
- What kinds of activities get bonus points from prospective renters?
- When do they prefer to be contacted?
- How do renters in your region differ from the rest of the U.S.?
We’re so glad you asked. We’re even more glad to share those answers.
Where does the data come from?
As a marketing automation platform serving hundreds of PMCs, PERQ has a unique vantage point to report on consumer trends. In this annual guide, we take self-reported consumer preference data from hundreds of thousands of digital renter interactions with PMC websites and flush out trending behaviors on national and regional levels.
Our goal is to equip you, multifamily marketers and operators, with the information you need to make better property-level decisions, increase your return on spend, and meet your own performance goals.
What type of multifamily insights can I expect to find?
From renter budgets to preferred floor plans, most-wanted features, parking needs, and move-in timeframes, you’ll learn a lot about what renters are looking for in a perfect home.
As you consider how to improve your community, host a resident event, partner with local businesses, or create a social media campaign, you’ll find the data insights in the Multifamily Field Guide helpful for steering your decisions and defending your investments.
Trending renter preferences: National highlights
There’s a lot multifamily marketers can glean from the 60(ish) pages in our Multifamily Field Guide. We won’t get as deep in this post. Rather, we’ll highlight select trending insights on a national level. (We invite you to download the full report below for the whole shebang, including data specific to your region.)
Without further ado:
Top Features to Prospective Renters
- In-unit laundry
- Modern appliances
- Walk-in closets
- Balcony
- Open floor plan
Keep in mind each U.S. region has its own version of this list. Nationally, renters also prefer one-bedroom, one-bathroom units. In all, more than 75% of rental prospects describe their ideal apartment as comfortable, yet simple and affordable.
Unsurprisingly, 75.85% prioritize budget over square footage when considering available units, signaling a slight shift from last year’s numbers, when fewer people were as concerned with budget. By contrast, only 14.24% of prospective renters describe their ideal apartment as “luxurious with high-end features.”
Favored Activities
Nationally, renters report they prefer social, shopping and outdoor activities, ranking these three higher than family, leisure, sporting and cultural activities.
One in three renters have a pet, yet nearly seven in 10 say their communities are not pet friendly! Communities with pet-friendly policies or features have an opportunity to showcase those attributes in their marketing messaging, both to current and would-be residents.
Preferred tour type
While nearly 60% of prospective renters still prefer in-person tours, that’s a slight drop from last year’s numbers. Live and pre-recorded videos are a near tie in second place as the next preferred tour type. Pre-recorded video and virtual tours both saw an increase since last year.
Move-in windows
While close to 30% of renters are looking to move within a month, another 30% is still 3-6 months out from moving. Personalized, automated lead nurture is ideal for keeping your community top-of-mind for these renters who are taking their sweet time searching for the perfect home months in advance.
Preferred communications
As Gen Z overtakes the rental market, it’s easy to see why most prospective renters prefer to communicate via text and email, with roughly two in 10 preferring to talk by phone.
“There’s a generational shift happening,” said Meagan Struve, marketing analyst at Mission Rock. “They’re used to a more automated experience and the instant gratification that comes with that,” she explained: “They don’t want to talk to anyone on the phone, ever. They would much rather have a chatbot experience or have someone emailing or texting.”
On that note, nearly half of prospective renters prefer to be contacted in the morning, followed by afternoon and lunchtime. Evenings rank as the least favorite time renters want to hear from leasing agents.
Zeroing in on multifamily insights most meaningful to multifamily marketers
Allow us to stress once again that regional renter behaviors might differ from national trends presented above. To that end, the Multifamily Field Guide breaks down renter preferences in the Northeast, Southeast, Midwest, West, and Southwest.
Broken out in quick-read graphics, we trust these and other intel nuggets will stir up new ideas and highlight opportunities for you to accelerate your revenue and performance goals in 2023.
We invite multifamily marketers, like you, to access the full report below and share it with peers.
Every year, PERQ orchestrates more than 4 million remarkable renter experiences for hundreds of multifamily PMCs. Capturing insightful data, PERQ knows what renters want. From contact preferences to move-in time frames to preferred unit amenities and features, the Multifamily Field Guide identifies renter trends nationally and by region for multifamily marketers to use.
👉 Fill Out the Form to Access Your Copy