
One coordinated system that drives more leases at a lower cost per community.
Turn existing traffic into leases with a conversion-engineered site experience.
Connect marketing spend directly to every signed lease.
From recapping industry events to diving in deep on tips and trends, catch up on all things multifamily.
Watch PERQ’s multifamily marketing webinars, register for upcoming sessions, and hear PERQ leaders on industry podcasts.
Check out the upcoming events PERQ is a part of! From expos to conferences, learn more about what the PERQ team is doing and where we will be next!
Stay up to date with career opportunities at PERQ. Our culture is built on growth, learning, and making a meaningful impact on our team and community.
One coordinated system that drives more leases at a lower cost per community.
Turn existing traffic into leases with a conversion-engineered site experience.
Connect marketing spend directly to every signed lease.
From recapping industry events to diving in deep on tips and trends, catch up on all things multifamily.
Watch PERQ’s multifamily marketing webinars, register for upcoming sessions, and hear PERQ leaders on industry podcasts.
Check out the upcoming events PERQ is a part of! From expos to conferences, learn more about what the PERQ team is doing and where we will be next!
Stay up to date with career opportunities at PERQ. Our culture is built on growth, learning, and making a meaningful impact on our team and community.
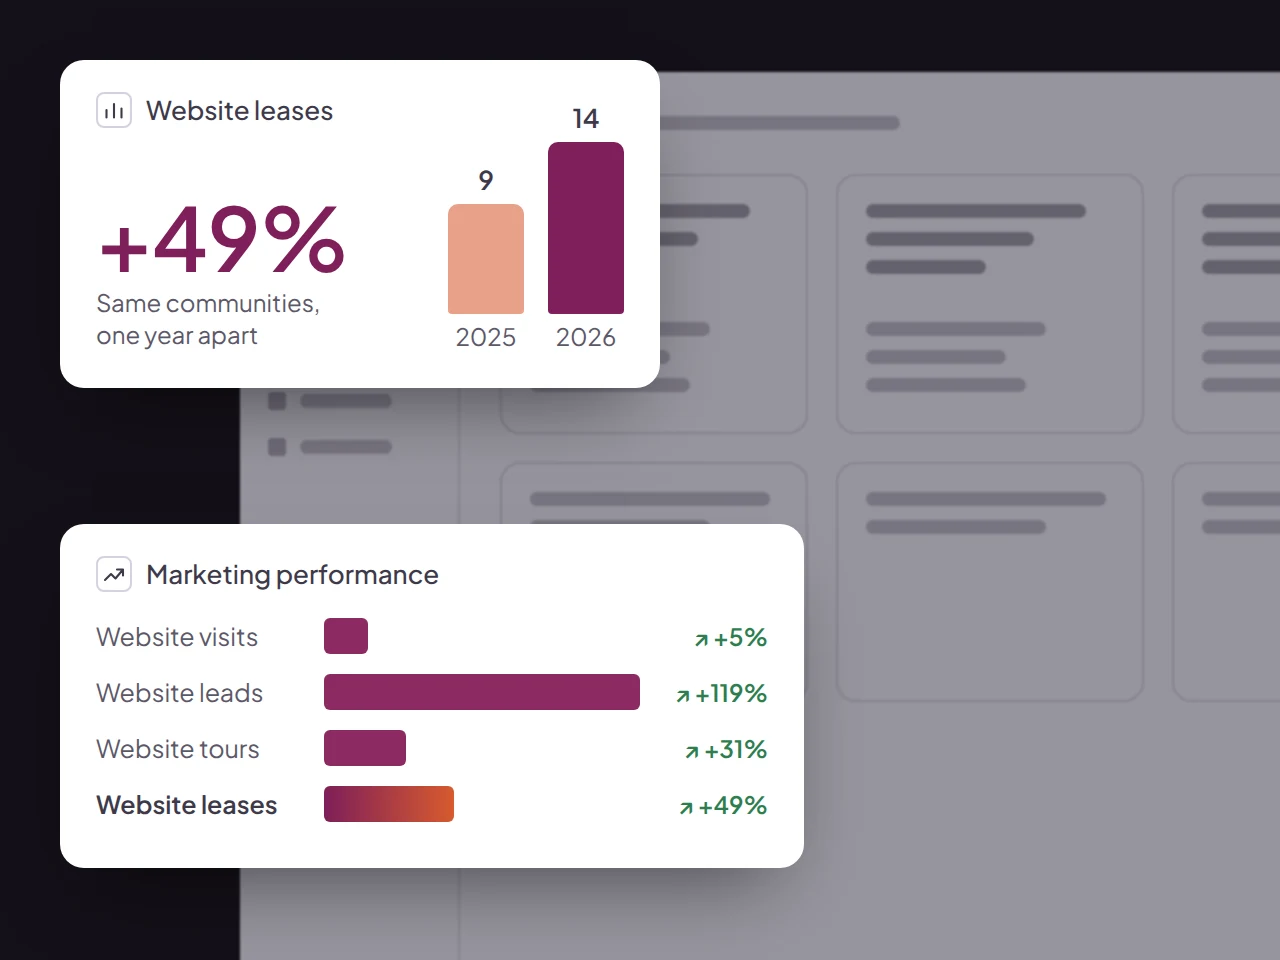
Leads, tours, and leases are website-sourced only. They don't include leasing from listing sites, walk-ins, phone calls, or referrals. Sources are the developer's Google Analytics (GA4) and property management system reports. All six PERQ communities launched June 1, 2026. Only three had Google Analytics tracking in 2025, so the year-over-year view uses those three.
Turn marketing into a measurable lease engine.
RESOURCES
COMPANY
© 2026 PERQ. All rights reserved.